In order to explain what a Histogram graph is, it is worth understanding what a frequency distribution is, as the two are mutually exclusive.
A frequency distribution records the number of times each value occurs in a sample being studied.
A Histogram is merely a way of showing that frequency on a bar chart format.
An Example
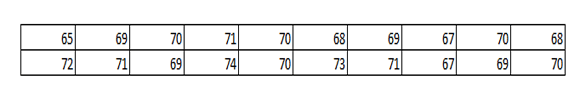
Frequently, the data collected from a statistical survey or investigation of some sort, result in simply a mass of numbers, like the data below. This isn’t enough. It doesn’t show what the average output is, or what to expect from the process. It isn’t visual enough!
Let’s take another look at the data table below and let’s also assume that this is from a 20 week study, measuring weekly output from a production line:
The next step toward creating a histogram graph is to arrange the data into a frequency distribution, which captures the number of times the above data has been observed (its frequency). In this example, we are looking for the output achieved in a given week, and how many times over a course of 20 weeks, seen below:

By converting the raw data into a frequency distribution, the data is now becoming clearer – we can start to see a picture of the data: the most frequented output and the least occurring, and so on.
The next step will be to use the data as visually as we can and By converting this into a Histogram, we can see clearly the make up of the process under investigation.

We can use the histogram graph to understand the performance of the process: its dispersion of data (its general shape). For a process that is in control, we would expect to see something that reflects a bell shape, like the one above.
We can also understand the probability of output occurring and/or not occurring. (In this case, expect to see the majority of output to be at around 69-70 units per week).
We can also use this distribution to see if the process is stable. If we measure it again for the next 20 weeks, we would expect to see the same shape of graph. If this isn’t the case, then we can investigate what special causes have affected the output this time.
In Summary
Histogram graphs are a good statistical tool, also used in Six Sigma, to understand, visually, the distribution of data in any given sample. We would expect to see a bell shape curve, similar to the illustration above, in processes that are in control.
This allows the observer to predict the typical expected results from the process.
Once the distribution of data is understood, we can measure future data to see if the distribution is still the same. If it isn’t (I.E. Skewed, Bimodal, etc) we can then start to ask pertinent questions as to why and what caused the process output to change. If for the better, understand the factor that has changed it for the greater good and lock it in to sustain this new process!
How to create a Histogram
- Open excel
- Enter all data captured into a worksheet – 1 cell per observation
- Once the sample has been completed, sort the data (so you have them in number order)
- Count each data set and add up the total number of observations for each set. (E.G. in the example above, there were 5 times the output of 70 for the week was reached, and 4 times for 69, and so on and so forth….)
- Create a distribution table Similar to the above example. The data set should be in the left column and the number of observations (or frequency) in the right hand column.
- Highlight the frequency column and select bar chart, adding the horizontal and vertical axis, plus name of graph etc. When happy, click Finish.
There you have it, a histogram of your process/sample!